
A Graphic Distraction
Unanswered questions about an unsourced scientific graph purportedly evincing an Iranian nuclear weapons program warrants caution by the arms control community, the media, and the IAEA.
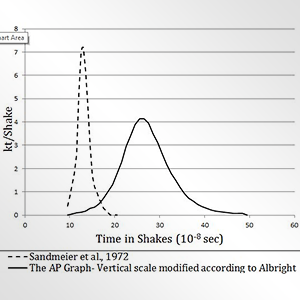
Comparison of data in an Associated Press graph and a 1972 Los Alamos Scientific Laboratory paper. Information is approximate and shown for illustrative purposes only. One shake equals ten nanoseconds. The vertical scale of the original AP graph has been modified according to David Albright’s interpretation (see below) and arbitrarily shifted on the horizontal scale so that that both sets of data can be displayed in one figure.
(Source: Adapted from George Jahn, “AP Exclusive: Graph Suggests Iran Working on Bomb,” Associated Press, November 27, 2012, and H.A. Sandmeier, S.A. Dupree, and G.E. Hansen, “Electromagnetic Pulse and Time-Dependent Escape of Neutrons and Gamma Rays from a Nuclear Explosion,” Nuclear Science and Engineering 48 (July 1972), pp. 343-52.)
In an online presentation last December, David Albright, president and founder of the Institute for Science and International Security (ISIS), takes issue with our recent article in the Bulletin of the Atomic Scientists where we identified a major flaw in a graph attributed to Iran allegedly showing the power and energy output from a nuclear explosion. The origin of the graph is unknown. According to Associated Press (AP) reporter George Jahn, “The diagram was leaked by officials from a country critical of Iran’s atomic program to bolster their arguments that Iran’s nuclear program must be halted… The officials provided the diagram only on condition that they and their country not be named.”
Albright takes issue with our conclusion that the “diagram does nothing more than indicate either slipshod analysis or an amateurish hoax,” contending that our assessment is “particularly unsupported by any facts or analysis.” We stand by our earlier statement. The “analysis” and “facts” needed to arrive to our conclusion are not particularly difficult to understand.
In fact, our conclusion follows quite naturally from two simple facts: First, there are scientific flaws in the graph as published. (While it is true that the flaw we exposed in our earlier article can be corrected by a change of units, the point is that, as published, the graph is mathematically flawed.) And second, the provenance of the graph is unknown. It could be of Iranian origin—though not necessarily from the Iranian government—or it could be “planted” by either sources within Iran or a foreign country (i.e. a forgery or hoax).
Because the nature of the error is so unambiguous, it remains our professional scientific opinion that it constitutes a slipshod analysis unlikely to have been made by professional scientists working at the national level. Similarly, if the incorrect unit label used was an oversight, that, too, is careless work not typical of professional scientists working at the national level.
Therefore, the graph indicates sloppy science of either Iranian or foreign origin—i.e., in the latter case, a forgery or hoax. Or as we stated in our original Bulletin article, the “diagram does nothing more than indicate either slipshod analysis or an amateurish hoax.”
In his presentation, Albright discusses a 1972 paper by H.A. Sandmeier, S.A. Dupree, and G.E. Hansen, (“Electromagnetic Pulse and Time-Dependent Escape of Neutrons and Gamma Rays from a Nuclear Explosion,” published in Nuclear Science and Engineering) arguing that the AP graph is similar to figure 2 in that paper, and that therefore the AP graph may be credible. In fact, the comparison proves the opposite of what Albright attempts to argue. If the AP graph and the one in Sandmeier et al. are plotted on the same time axis (see above), a significant discrepancy in the curves is evident. However, the Sandmeier et al. nuclear explosion model comes much closer to realistic models because the power curve correctly peaks within three to four shakes as expected (where one shake equals ten nanoseconds). The AP graph on the other hand takes much longer to reach its peak (~thirteen shakes), which is not typical of a fission explosion regardless of the yield. So from a technical standpoint, the AP graph is not similar to figure 2 in Sandmeier et al. (which the authors generated using the Los Alamos coupled hydrodynamic-neutronics “HENRE” computer code). The shapes of the curves, when plotted on the same time axis, are clearly different.
Therefore the conclusion of the ISIS presentation—”The HENRE [i.e. Sandmeier et al.] graphs are similar in shape to those reported by the AP … Thus, the AP graphs appear consistent in shape with graphs generated by advanced codes used to predict the behavior of a nuclear explosion”—is inconsistent with the facts. Indeed, if the time scale of the explosion is ignored, and one is only interested in a pedestrian similarity, then any number of vaguely “similar” graphs can be found in the literature—one was even identified by a reporter in a story titled “Iranian Bomb Graph Appears Adapted from One on Internet.” Of course, even that figure has a significantly shorter time scale than the AP graph, and therefore is much more realistic than the AP graph.
More fundamentally, any comparison of the AP graph to known graphs from the literature in order to establish the former’s credibility has logical limitations because there is no technical analysis of the scientific content of the AP graph that can clarify its origin and thus prove whether it is real or a hoax. Even if the AP graph and Sandmeier et al.’s figure 2 were identical, this would still not help clarify whether AP graph is real or a forgery.
We note that in the recent past, e.g., in the lead-up to the 2003 Iraq War, forged documents were passed on to the International Atomic Energy Agency (IAEA). And in a recent article for Foreign Policy, Mark Hibbs of the Carnegie Endowment for International Peace states: “Conversations with enough people who might know have persuaded me that the IAEA had likely seen and evaluated the document [AP graph] before it was leaked to the press, and that there was an internal discussion at the IAEA about whether the document was genuine and what it implied.” Thus, even after about two years of examining it, there is evidently still debate within the IAEA regarding the authenticity of the graph.
Nonetheless, on pages five and six of his presentation, Albright goes on to state that the AP graph may be linked to information contained in the IAEA’s November 2011 report on Iran, specifically paragraph fifty-two of the Annex:
Information provided to the Agency [IAEA] by two Member States relating to modelling studies alleged to have been conducted in 2008 and 2009 by Iran is of particular concern to the Agency. According to that information, the studies involved the modelling of spherical geometries, consisting of components of the core of an HEU nuclear device subjected to shock compression, for their neutronic behaviour at high density, and a determination of the subsequent nuclear explosive yield. The information also identifies models said to have been used in those studies and the results of these calculations, which the Agency has seen. The application of such studies to anything other than a nuclear explosive is unclear to the Agency.
If Albright is correct that the IAEA is referring here to the unauthenticated graph leaked to the AP by “a country critical of Iran’s atomic program,” this is obviously an extremely serious and very troubling development. Unfortunately, this may be exactly what occurred. According to the AP, “A senior diplomat who is considered neutral on the issue confirmed that the graph obtained by the AP was indeed one of those cited by the IAEA in that report.” In our opinion, the IAEA should only discuss authenticated evidence in its reports on Iran and not graphs that, according to Hibbs, are not directly authenticated by the agency. If the IAEA has indeed been confronting Iran with unauthenticated evidence, Iran, like Iraq before it, may well be telling the truth when it responds by saying that such “evidence” is fabricated.
We agree with Albright when he writes that, “Based on publicly available information, it is too early to conclude who did the calculations or for what purpose….” We would only add that the origin of the graph is also unknown, aside from the fact that, according to the AP, it “was leaked by officials from a country critical of Iran’s atomic program to bolster their arguments that Iran’s nuclear program must be halted.”
Robert Kelley, a nuclear engineer and 35-year veteran of the US nuclear weapons complex at Los Alamos and Lawrence Livermore national laboratories, and twice director of IAEA inspections teams in Iraq, warns of the consequences of taking such information at face value: “[W]e should not again be held hostage to forgeries and the spinning of data to make the worst case. If Iran is developing nuclear weapons, let it be proved through the analysis of current, solid information—not recycled, discredited data. If there is to be a war with Iran, let’s not have a repeat, afterward, of the anguished articles and books from officials who kept their misgivings to themselves. Let’s get all the facts on the table now.”
Regarding the broader picture of the possible military dimensions of Iran’s nuclear program, Kelley states in a January 31 blog post (and in an earlier article in Nuclear Intelligence Weekly) that:
…the basis for the IAEA’s requests continues to be opaque. The timeline for the alleged experiments is also highly suspect, with claims that massive experimental facilities had been fabricated even before they had been designed, according to the available information. The IAEA work to date, including the mischaracterization of satellite images of Parchin, is more consistent with an IAEA agenda to target Iran than of technical analysis. [emphasis added]
In the same article, Kelley also raises serious doubts about the IAEA’s technical competence with regard to its analysis of a possible Syrian nuclear reactor:
…[T]he IAEA cavalierly dismissed Syrian explanations that the natural uranium particles found at a bombed suspect site came from Israeli missiles. The agency’s claims that the particles are not of the correct isotopic and chemical composition for deep earth penetrating bombs, not missiles, displays an appalling lack of technical knowledge about military munitions based on information from questionable sources. If the IAEA is to be trusted it must get proper technical advice. [emphasis added]
To put this entire “AP graph” issue into context, let’s not forget that in 2009 a military institute in Brazil published a doctoral thesis titled “Numerical Simulation of Thermonuclear Detonations in Fission-Fusion Hybrids Imploded by Radiation,” which involved calculations about the performance of the US W87 warhead. That thesis is directly relevant to nuclear weaponization, is authenticated, and is a far more serious matter than the unauthenticated and flawed AP graph. If the AP graph is a concern, then certainly the Brazilian study exceeds that threshold of concern. Furthermore, in 2004, Brazilian authorities did not permit IAEA inspectors to visit parts of their Resende uranium enrichment facility, but Brazil was not found in violation of its obligations under the Treaty on the Non-Proliferation of Nuclear Weapons (NPT) over this incident. Would similar behavior by Iran be tolerated?
Until the AP graph is authenticated, it should be ignored. In fact, the IAEA should make sure that all evidence it presents in its case against Iran is authenticated, of the highest quality, and is not leaked to the media or anyone else. If there is the slightest doubt as to the authenticity of any evidence against Iran, it should be excluded from all official IAEA reports and proceedings. Of course, if there is solid evidence against Iran—for example involving the potential diversion of nuclear material—then Iran, as with all members of the NPT, should be required to respond to it.
Yousaf Butt is a research professor and scientist-in-residence, and Ferenc Dalnoki-Veress is an adjunct professor and scientist-in-residence at the James Martin Center for Nonproliferation Studies, Monterey Institute for International Studies.